Featured in:Best AI Writing Tools
Get featured →🚀 Zaprep: Your Socials on Steroids. Start free — automate 1,000 DMs/month & turn engagement into leads. with 1,000 automated DMs/month.

PaperBanana AI Diagram Generator


✦
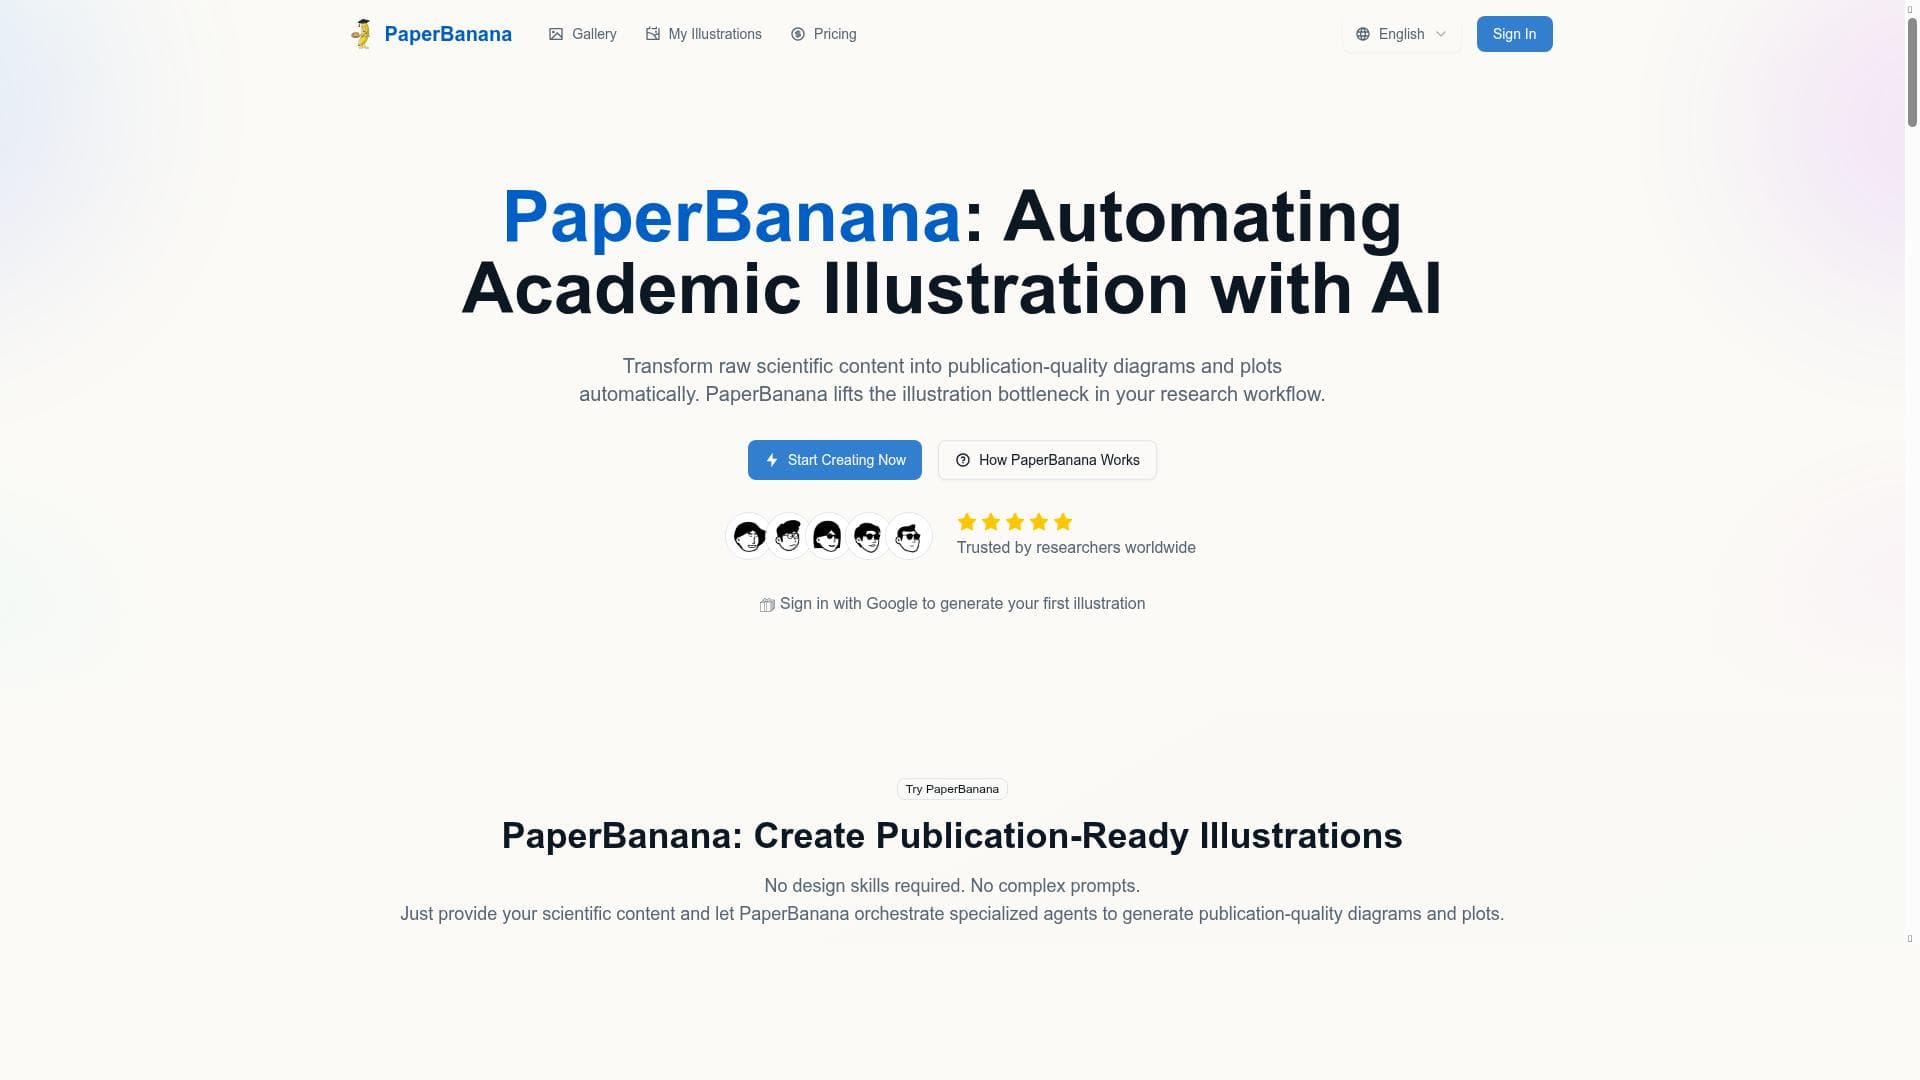
PaperBanana AI Diagram Generator is a cutting-edge AI tool designed to create publication-ready methodology diagrams, scientific plots, and research workflows with ease. Ideal for researchers and academics, it transforms complex scientific data into clear, professional visuals quickly, streamlining the preparation of research papers and presentations.

Description
PaperBanana is an AI-powered diagram generator designed specifically for creating publication-ready methodology diagrams, scientific plots, and research workflows. It helps researchers and academics generate clear, professional academic visuals and technical workflows quickly and efficiently, enhancing the presentation of scientific figures and research papers.
Detailed Description
PaperBanana AI Diagram Generator is a specialized AI-powered tool designed to streamline the creation of high-quality, publication-ready diagrams and visuals tailored specifically for academic and scientific research. Its core purpose is to assist researchers, academics, and scientists in producing clear, professional methodology diagrams, scientific plots, and research workflows that enhance the clarity and impact of their research presentations and publications. By leveraging advanced AI models, PaperBanana automates and simplifies the often time-consuming process of designing technical visuals, allowing users to focus more on their research content rather than the complexities of graphic design. The tool offers a robust set of features that cater directly to the needs of the academic community. Users can create detailed methodology diagrams that visually represent experimental setups or research processes, ensuring that complex procedures are communicated effectively. It also supports the generation of scientific plots, which are essential for data visualization in research papers, enabling users to convert raw data into insightful graphs and charts with ease. Additionally, PaperBanana facilitates the design of research workflows, helping to map out the sequence of research activities or data analysis pipelines in a clear and organized manner. These capabilities are complemented by the tool’s ability to produce clear academic visuals quickly, which is crucial for meeting tight publication deadlines. The platform is built with a focus on academic figures and papers, ensuring that the output meets the high standards required by scientific journals and conferences. Furthermore, it supports technical visuals that are often required in specialized research fields, making it a versatile solution for a wide range of scientific disciplines. PaperBanana is best suited for researchers, academics, graduate students, and scientific professionals who regularly prepare research papers, presentations, or grant proposals. It is particularly valuable for those who need to communicate complex methodologies and data visually but may lack advanced graphic design skills. Use cases include preparing figures for journal submissions, creating visuals for conference posters, illustrating workflows for grant applications, and developing educational materials for academic courses. By automating diagram generation, PaperBanana saves significant time and effort, allowing users to produce polished visuals without the need for external graphic design support. In terms of pricing, PaperBanana operates on a freemium model, offering a free tier that provides access to basic features suitable for occasional users or those just starting out. Paid plans unlock advanced functionalities, higher output resolutions, and additional customization options, catering to the needs of frequent users or larger research groups. This flexible pricing structure makes it accessible to individual researchers as well as academic institutions. Compared to alternative diagramming tools, PaperBanana stands out due to its AI-driven approach specifically tailored to academic and scientific contexts. While general diagramming software may require manual design work and lack domain-specific templates, PaperBanana’s AI models automate much of the process and provide outputs that align with scientific publication standards. This focus on research visuals differentiates it from more generic tools like Microsoft Visio or Lucidchart. However, unlike some highly customizable graphic design software, PaperBanana prioritizes ease of use and speed over extensive manual editing capabilities. Notable limitations include potential constraints in customization depth compared to professional graphic design tools, which might be a consideration for users needing highly bespoke visuals. Additionally, as with any AI-powered tool, the quality of generated diagrams may depend on the clarity of user inputs and the complexity of the research content. Users should also verify that the generated visuals meet the specific formatting requirements of their target journals or conferences. Overall, PaperBanana AI Diagram Generator offers a powerful, efficient solution for academic visual content creation, significantly enhancing the workflow of researchers and academics focused on producing high-quality scientific figures and diagrams.
Tool Features
- Create publication-ready methodology diagrams
- Generate scientific plots
- Design research workflows
- Produce clear academic visuals quickly
- Built specifically for academic figures and papers
- Supports technical visuals for research
Description
✦
PaperBanana AI Diagram Generator is a cutting-edge AI tool designed to create publication-ready methodology diagrams, scientific plots, and research workflows with ease. Ideal for researchers and academics, it transforms complex scientific data into clear, professional visuals quickly, streamlining the preparation of research papers and presentations.
PaperBanana is an AI-powered diagram generator designed specifically for creating publication-ready methodology diagrams, scientific plots, and research workflows. It helps researchers and academics generate clear, professional academic visuals and technical workflows quickly and efficiently, enhancing the presentation of scientific figures and research papers.
Detailed Description
PaperBanana AI Diagram Generator is a specialized AI-powered tool designed to streamline the creation of high-quality, publication-ready diagrams and visuals tailored specifically for academic and scientific research. Its core purpose is to assist researchers, academics, and scientists in producing clear, professional methodology diagrams, scientific plots, and research workflows that enhance the clarity and impact of their research presentations and publications. By leveraging advanced AI models, PaperBanana automates and simplifies the often time-consuming process of designing technical visuals, allowing users to focus more on their research content rather than the complexities of graphic design. The tool offers a robust set of features that cater directly to the needs of the academic community. Users can create detailed methodology diagrams that visually represent experimental setups or research processes, ensuring that complex procedures are communicated effectively. It also supports the generation of scientific plots, which are essential for data visualization in research papers, enabling users to convert raw data into insightful graphs and charts with ease. Additionally, PaperBanana facilitates the design of research workflows, helping to map out the sequence of research activities or data analysis pipelines in a clear and organized manner. These capabilities are complemented by the tool’s ability to produce clear academic visuals quickly, which is crucial for meeting tight publication deadlines. The platform is built with a focus on academic figures and papers, ensuring that the output meets the high standards required by scientific journals and conferences. Furthermore, it supports technical visuals that are often required in specialized research fields, making it a versatile solution for a wide range of scientific disciplines. PaperBanana is best suited for researchers, academics, graduate students, and scientific professionals who regularly prepare research papers, presentations, or grant proposals. It is particularly valuable for those who need to communicate complex methodologies and data visually but may lack advanced graphic design skills. Use cases include preparing figures for journal submissions, creating visuals for conference posters, illustrating workflows for grant applications, and developing educational materials for academic courses. By automating diagram generation, PaperBanana saves significant time and effort, allowing users to produce polished visuals without the need for external graphic design support. In terms of pricing, PaperBanana operates on a freemium model, offering a free tier that provides access to basic features suitable for occasional users or those just starting out. Paid plans unlock advanced functionalities, higher output resolutions, and additional customization options, catering to the needs of frequent users or larger research groups. This flexible pricing structure makes it accessible to individual researchers as well as academic institutions. Compared to alternative diagramming tools, PaperBanana stands out due to its AI-driven approach specifically tailored to academic and scientific contexts. While general diagramming software may require manual design work and lack domain-specific templates, PaperBanana’s AI models automate much of the process and provide outputs that align with scientific publication standards. This focus on research visuals differentiates it from more generic tools like Microsoft Visio or Lucidchart. However, unlike some highly customizable graphic design software, PaperBanana prioritizes ease of use and speed over extensive manual editing capabilities. Notable limitations include potential constraints in customization depth compared to professional graphic design tools, which might be a consideration for users needing highly bespoke visuals. Additionally, as with any AI-powered tool, the quality of generated diagrams may depend on the clarity of user inputs and the complexity of the research content. Users should also verify that the generated visuals meet the specific formatting requirements of their target journals or conferences. Overall, PaperBanana AI Diagram Generator offers a powerful, efficient solution for academic visual content creation, significantly enhancing the workflow of researchers and academics focused on producing high-quality scientific figures and diagrams.
Frequently Asked Questions
What is PaperBanana AI Diagram Generator?
PaperBanana AI Diagram Generator is an AI-powered tool designed to help researchers and academics create high-quality, publication-ready methodology diagrams, scientific plots, and research workflows efficiently and professionally.
How much does PaperBanana AI Diagram Generator cost?
PaperBanana offers a freemium pricing model with a free tier that includes basic features. Paid plans provide access to advanced functionalities, higher resolution outputs, and additional customization options.
Who is PaperBanana AI Diagram Generator best for?
It is best suited for researchers, academics, graduate students, and scientific professionals who need to create clear and professional academic visuals for research papers, presentations, and grant proposals.
What are the main features of PaperBanana AI Diagram Generator?
Key features include creating publication-ready methodology diagrams, generating scientific plots, designing research workflows, producing clear academic visuals quickly, and supporting technical visuals tailored for academic figures and papers.
Does PaperBanana AI Diagram Generator offer a free trial?
Yes, PaperBanana provides a free tier that allows users to access basic features, effectively serving as a free trial to explore the tool's capabilities.
What integrations does PaperBanana AI Diagram Generator support?
Currently, PaperBanana focuses on standalone diagram generation tailored for academic use. Specific third-party integrations are not prominently featured but may be available or planned for future updates.
How does PaperBanana AI Diagram Generator work?
Users input their research data or methodology details into the platform, and the AI models automatically generate clear, publication-quality diagrams, plots, and workflows that can be customized and exported for use in academic publications.
Reviews
0 reviews
No reviews yet. Be the first to share your experience.
Sponsored Tools



































Recommended Tools
Stay updated on latest Ai tools
Get the latest insights, Join our newsletter
Read and trusted by 50,000+ readers
Join the biggest AI Community
Our community and staff are here to help!
Your feedback will help Alice AI improve in future versions.








Submit your Tool


PoweredByAI.app is an AI Tools Directory helping individuals, businesses, and creators discover the best AI tools for writing, coding, design, productivity, and more.
© 2026 , Product of011BQ. All rights reserved.