🚀 Zaprep: Tus redes sociales al máximo. Empezar gratis — automatiza 1,000 DMs/mes y convierte el engagement en leads. con 1,000 DMs automatizados/mes.


¿Es esta tu herramienta de IA? Reclámala hoy.
Verifica la propiedad, gestiona tu perfil y desbloquea funciones de crecimiento.
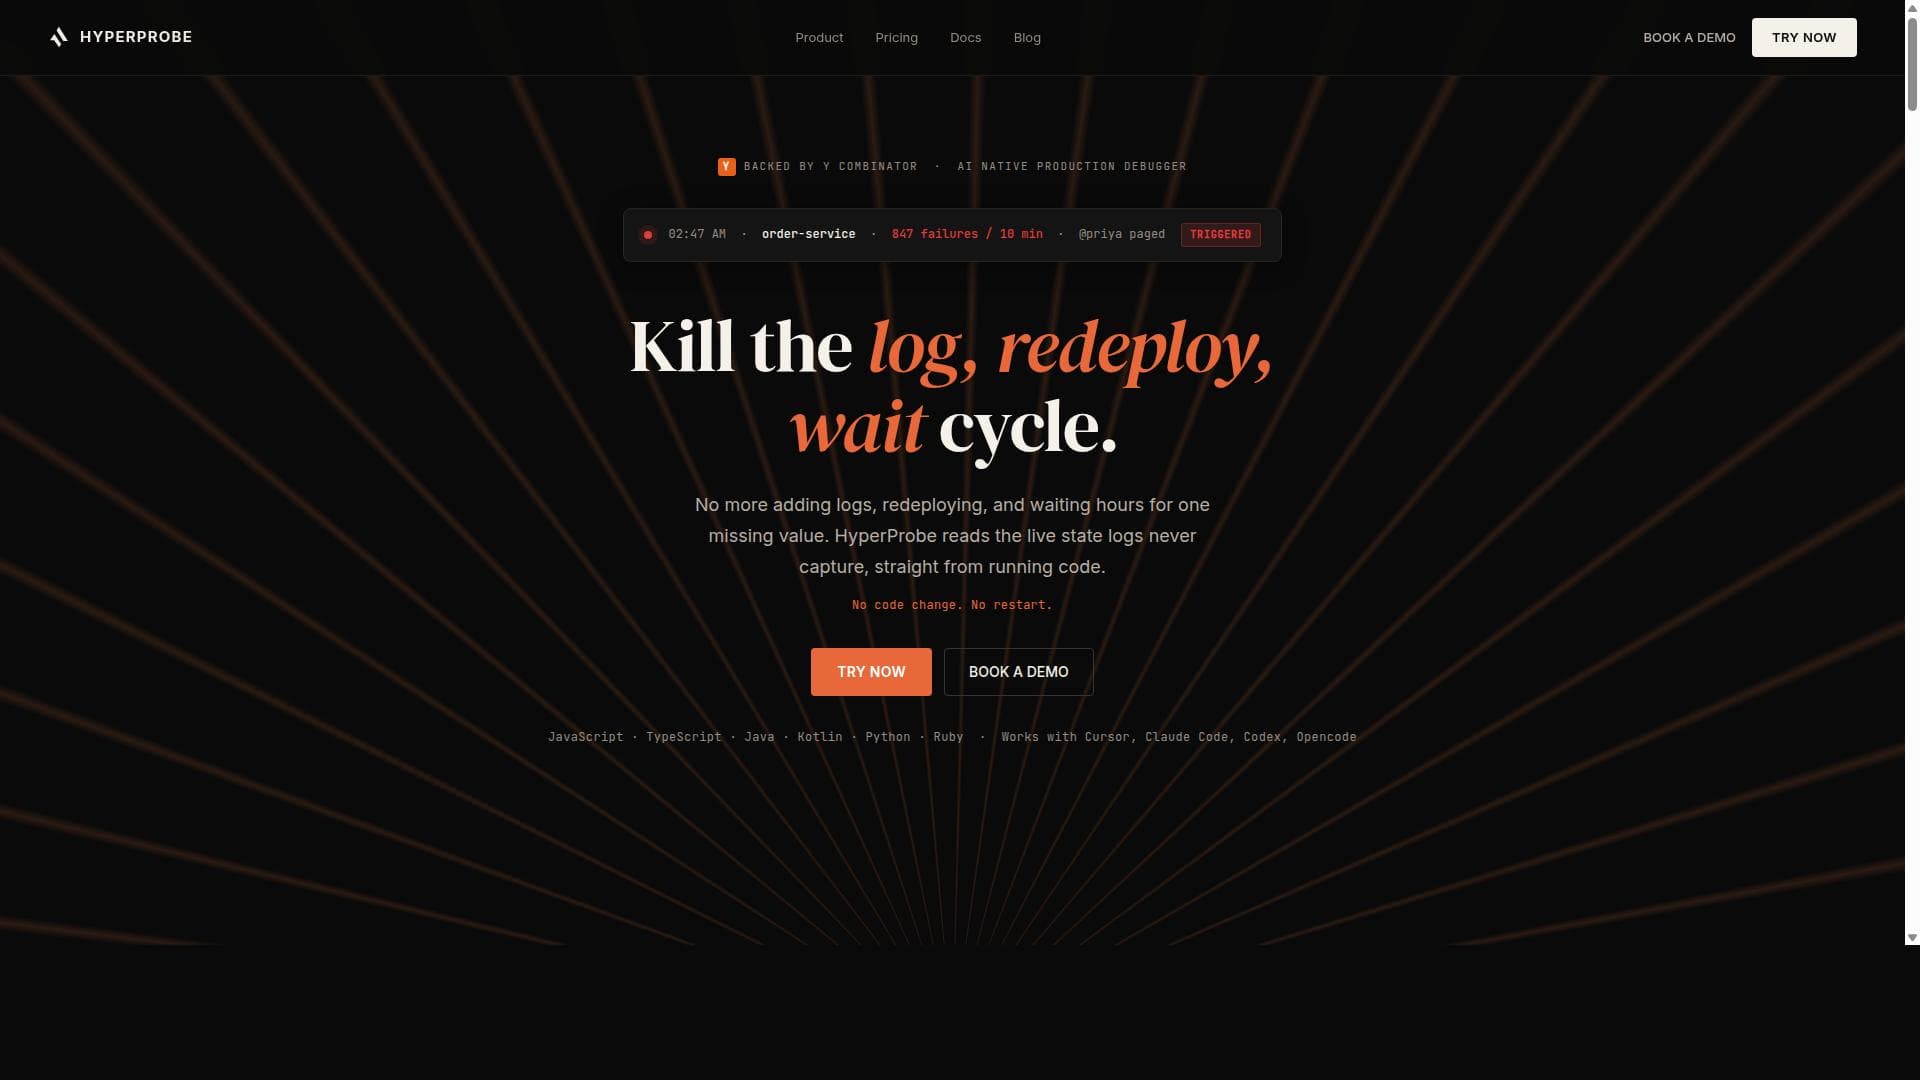
HyperProbe is an AI-native production debugger that instantly reads live state logs from running code without redeployments or restarts, enabling engineers to pinpoint root causes in under ten minutes. Ideal for teams frustrated by slow, guesswork-heavy debugging, it integrates with popular alerting tools and runs securely within your infrastructure to streamline incident resolution.

Descripción
HyperProbe is how backend teams debug production issues they can't reproduce locally. Instead of adding a log line and waiting on a deploy, we let Claude Code, Codex, or Cursor drop read-only probes into a running service and capture the variable state that was never recorded. From there your agent debugs like it has a local repro, closing the bug in one sitting.
Descripción detallada
HyperProbe is an AI-native production debugging tool designed to revolutionize how engineering teams identify and resolve incidents in live production environments. Unlike traditional debugging methods that rely heavily on adding logs, redeploying code, and enduring long wait times to capture missing data, HyperProbe eliminates these cumbersome steps by reading live state logs directly from running code without any need for code changes or service restarts. This capability allows engineers to quickly pinpoint the root cause of production issues with unprecedented speed and accuracy. At its core, HyperProbe drops a read-only probe on the exact line of code where a problem occurs in production. This virtual breakpoint captures the precise variable state at the moment the breakpoint fires on live traffic, providing data that conventional logs often miss. This means teams no longer have to guess or rely on incomplete information to diagnose issues. The tool integrates seamlessly with popular alerting and monitoring platforms such as PagerDuty, Datadog, and Slack, automatically picking up alerts and initiating the debugging workflow. It reads logs and traces to locate the specific file and line where the issue originated, then plans the debugging flow accordingly. HyperProbe’s unique approach ensures that diagnosis is verified against real evidence, confirming root cause analysis rather than relying on assumptions or educated guesses. It runs securely inside your infrastructure, offering self-hosted or private VPC deployment options to meet stringent security requirements. This makes it suitable for organizations with strict compliance and data privacy needs. The tool is ideal for engineering teams who frequently deal with production incidents that disrupt their product roadmap and consume valuable developer time. By drastically reducing the time to root cause from hours to under ten minutes, HyperProbe frees senior engineers from prolonged on-call debugging sessions, allowing them to focus on building new features instead of firefighting. Use cases include resolving race conditions during peak traffic, catching silent data mismatches that are hard to reproduce locally, and quickly diagnosing failures that standard logs fail to capture. Regarding pricing, HyperProbe provides options to try the tool immediately via a quickstart guide and offers demos to help teams understand its capabilities in context. While specific pricing details are available on their website, the emphasis on reducing redeployments and senior engineer involvement suggests significant cost savings over traditional debugging workflows. Compared to alternatives, HyperProbe stands out by capturing exact evidence from live production code without requiring any code instrumentation or restarts. Many other debugging tools depend on pre-existing logs or require redeployments to add new logging statements, which delays resolution and increases downtime. HyperProbe’s AI-driven approach to automatically locate the problematic code line and place virtual breakpoints makes it a cutting-edge solution in the production debugging space. However, potential users should consider that HyperProbe currently supports languages such as JavaScript, TypeScript, Java, Kotlin, Python, and Ruby, so teams using other languages may need to verify compatibility. Additionally, while the tool integrates with major alerting platforms, organizations relying on less common systems should confirm integration support. As with any self-hosted or private VPC solution, setup and maintenance require some infrastructure investment. In summary, HyperProbe is a powerful AI-driven debugger designed to eliminate the traditional log-redeploy-wait cycle by providing real-time, evidence-backed insights directly from running production code. It is best suited for engineering teams seeking to accelerate incident resolution, reduce on-call burdens, and improve overall system reliability without compromising security or requiring code changes.
Características de la herramienta
- Drops a read-only probe on the exact line where the problem happened in production
- Captures data that logs do not have without redeployment or restarting the service
- Integrates with PagerDuty, Datadog, and Slack to automatically pick up alerts
- Reads logs and traces to locate the file and line with the issue and plan debugging flow
- Places a read-only virtual breakpoint on the suspect line with no redeploy
- Captures exact variable state at breakpoint firing on live traffic
- Diagnosis is verified against real evidence to confirm root cause analysis
- Runs inside your infrastructure with self-hosted or private VPC options ensuring security
Descripción
HyperProbe is an AI-native production debugger that instantly reads live state logs from running code without redeployments or restarts, enabling engineers to pinpoint root causes in under ten minutes. Ideal for teams frustrated by slow, guesswork-heavy debugging, it integrates with popular alerting tools and runs securely within your infrastructure to streamline incident resolution.
HyperProbe is how backend teams debug production issues they can't reproduce locally. Instead of adding a log line and waiting on a deploy, we let Claude Code, Codex, or Cursor drop read-only probes into a running service and capture the variable state that was never recorded. From there your agent debugs like it has a local repro, closing the bug in one sitting.
Descripción detallada
HyperProbe is an AI-native production debugging tool designed to revolutionize how engineering teams identify and resolve incidents in live production environments. Unlike traditional debugging methods that rely heavily on adding logs, redeploying code, and enduring long wait times to capture missing data, HyperProbe eliminates these cumbersome steps by reading live state logs directly from running code without any need for code changes or service restarts. This capability allows engineers to quickly pinpoint the root cause of production issues with unprecedented speed and accuracy. At its core, HyperProbe drops a read-only probe on the exact line of code where a problem occurs in production. This virtual breakpoint captures the precise variable state at the moment the breakpoint fires on live traffic, providing data that conventional logs often miss. This means teams no longer have to guess or rely on incomplete information to diagnose issues. The tool integrates seamlessly with popular alerting and monitoring platforms such as PagerDuty, Datadog, and Slack, automatically picking up alerts and initiating the debugging workflow. It reads logs and traces to locate the specific file and line where the issue originated, then plans the debugging flow accordingly. HyperProbe’s unique approach ensures that diagnosis is verified against real evidence, confirming root cause analysis rather than relying on assumptions or educated guesses. It runs securely inside your infrastructure, offering self-hosted or private VPC deployment options to meet stringent security requirements. This makes it suitable for organizations with strict compliance and data privacy needs. The tool is ideal for engineering teams who frequently deal with production incidents that disrupt their product roadmap and consume valuable developer time. By drastically reducing the time to root cause from hours to under ten minutes, HyperProbe frees senior engineers from prolonged on-call debugging sessions, allowing them to focus on building new features instead of firefighting. Use cases include resolving race conditions during peak traffic, catching silent data mismatches that are hard to reproduce locally, and quickly diagnosing failures that standard logs fail to capture. Regarding pricing, HyperProbe provides options to try the tool immediately via a quickstart guide and offers demos to help teams understand its capabilities in context. While specific pricing details are available on their website, the emphasis on reducing redeployments and senior engineer involvement suggests significant cost savings over traditional debugging workflows. Compared to alternatives, HyperProbe stands out by capturing exact evidence from live production code without requiring any code instrumentation or restarts. Many other debugging tools depend on pre-existing logs or require redeployments to add new logging statements, which delays resolution and increases downtime. HyperProbe’s AI-driven approach to automatically locate the problematic code line and place virtual breakpoints makes it a cutting-edge solution in the production debugging space. However, potential users should consider that HyperProbe currently supports languages such as JavaScript, TypeScript, Java, Kotlin, Python, and Ruby, so teams using other languages may need to verify compatibility. Additionally, while the tool integrates with major alerting platforms, organizations relying on less common systems should confirm integration support. As with any self-hosted or private VPC solution, setup and maintenance require some infrastructure investment. In summary, HyperProbe is a powerful AI-driven debugger designed to eliminate the traditional log-redeploy-wait cycle by providing real-time, evidence-backed insights directly from running production code. It is best suited for engineering teams seeking to accelerate incident resolution, reduce on-call burdens, and improve overall system reliability without compromising security or requiring code changes.
Preguntas frecuentes
What is HyperProbe?
HyperProbe is an AI-native production debugging tool that reads live state logs directly from running code to help engineers quickly identify and resolve production incidents without adding logs, redeploying, or restarting services.
How much does HyperProbe cost?
Pricing details for HyperProbe are available on their website. They offer options to try the tool via a quickstart guide and provide demos to help teams evaluate its fit before purchasing.
Who is HyperProbe best for?
HyperProbe is best suited for engineering teams and senior developers who manage production systems and want to reduce incident resolution time, minimize redeployments, and avoid prolonged on-call debugging sessions.
What are the main features of HyperProbe?
Key features include dropping read-only probes on exact lines where issues occur, capturing variable states on live traffic, integrating with PagerDuty, Datadog, and Slack for automatic alert ingestion, reading logs and traces to locate problem code, and running securely inside your infrastructure with self-hosted or private VPC options.
Does HyperProbe offer a free trial?
HyperProbe provides a quickstart guide to try the tool immediately and offers demo bookings, allowing teams to experience its capabilities before committing.
What integrations does HyperProbe support?
HyperProbe integrates with popular alerting and monitoring platforms including PagerDuty, Datadog, and Slack to automatically pick up incident alerts and streamline the debugging workflow.
How does HyperProbe work?
When an incident fires, HyperProbe automatically picks up alerts from integrated platforms, reads logs and traces to locate the problematic file and line, places a read-only virtual breakpoint on that line without redeployment, and captures the exact variable state on live traffic to provide precise root cause analysis.
Reseñas
Aún no hay reseñas. Sé el primero en compartir tu experiencia.
Herramientas patrocinadas




























Herramientas recomendadas
Mantente al día con las últimas herramientas de IA
Obtén las últimas novedades, únete a nuestro boletín
Leído y confiado por 50,000+ lectores
Únete a la comunidad de IA más grande
¡Nuestra comunidad y equipo están aquí para ayudarte!
Tus comentarios ayudarán a Alice AI a mejorar en futuras versiones.








Enviar tu herramienta


PoweredByAI.app es un directorio de herramientas de IA que ayuda a personas, empresas y creadores a descubrir las mejores herramientas de IA para escritura, programación, diseño, productividad y más.
© 2026 , Producto de011BQ. Todos los derechos reservados.